Data Visualisation

Training Courses, Workshops and Seminars

Report Automation – Excel to PowerPoint with R

2023-09-01T06:37:03+00:00October 5th, 2020|Tags: , , , |

Report automation can deliver powerful, time-saving results. This course teaches analytics professionals to automate the creation of PowerPoint packs from input Excel workbooks using R. Time is allotted for students to implement techniques taught so that, by the end of the course, students will have wrangled input data, created plots and tables, defined a PowerPoint template, and built a sample set of slides.

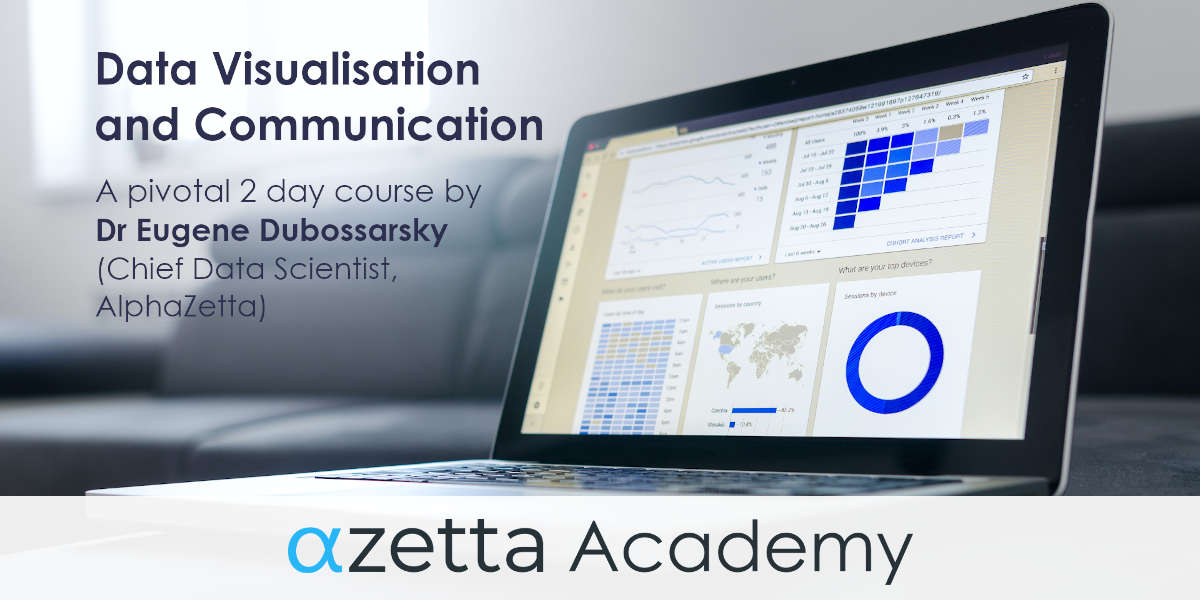
Data Visualisation and Communication

2021-09-08T03:57:01+00:00August 20th, 2020|Tags: , , , |

This course prepares data analytics professionals to communicate analytics results to business audiences, in a business context while being mindful of the skills, incentives, priorities and psychology of the audience. It also equips analysts [...]

Intro to R (+ data visualisation)

2021-04-13T04:19:20+00:00December 5th, 2018|Tags: , |

This R training course will introduce you to the R programming language, teaching you to create functions and customise code so you can manipulate data and begin to use R self-sufficiently in your work. R is the world’s most popular data mining and statistics package. It’s also free, and easy to use, with a range of intuitive graphical interfaces.

Data Science and Big Data Analytics: Leveraging Best Practices and Avoiding Pitfalls

2021-07-23T01:00:38+00:00May 13th, 2019|Tags: , , , , , , |

Data science is the key to business success in the information economy. This workshop will teach you about best practices in deploying a data science capability for your organisation. Technology is the easy part; the hard part is creating the right organisational and delivery framework in which data science can be successful in your organisation. We will discuss the necessary skill sets for a successful data scientist and the environment that will allow them to thrive. We will draw a strong distinction between “Data R&D” and “Data Product” capabilities within an enterprise and speak to the different skill sets, governance, and technologies needed across these areas. We will also explore the use of open data sets and open source software tools to enable best results from data science in large organisations. Advanced data visualisation will be described as a critical component of a big data analytics deployment strategy. We will also talk about the many pitfalls and how to avoid them.

Overcoming Information Overload with Advanced Practices in Data Visualisation

2021-07-23T01:02:29+00:00May 14th, 2019|Tags: , , , , , , , |

In this workshop, we explore best practices in deriving insight from vast amounts of data using visualisation techniques. Examples from traditional data as well as an in-depth look at the underlying technologies for visualisation in support of geospatial analytics will be undertaken. We will examine visualisation for both strategic and operational BI.

Go to Top